
Football Analytics
Implementing Football Analytics Pipeline Using Azure, Databricks & ML for SWIFT Insights



Every football fan has been there: jumping between multiple websites, dashboards, and tables just to answer a simple question - How is my team really performing over time, and why?
This project started from that exact frustration, but soon found redemption from the immense support of Chanukya, while I worked alongside Krishna to build an end-to-end analytics solution which delivers fast insights into the English Premier League, at the speed of an auto-refresh.
The Underlying Motivation For This Project:
Stakeholders often rely on fragmented reports from different web pages. These reports rarely show how performance evolves week by week, or which factors actually drive corresponding performance.
Our goal was simple:
reduce cognitive load and
turn scattered football data into a single, continuously updated source of insight.
From Raw Semi-Structured Data to Reliable, Quick Insight
The journey began with batch-driven data ingestion of the English Premier League reports from the Football-Data API on a weekly basis. The workflow and storage were orchestrated using a parameterized pipeline in Azure Data Factory and Azure Data Lake respectively.
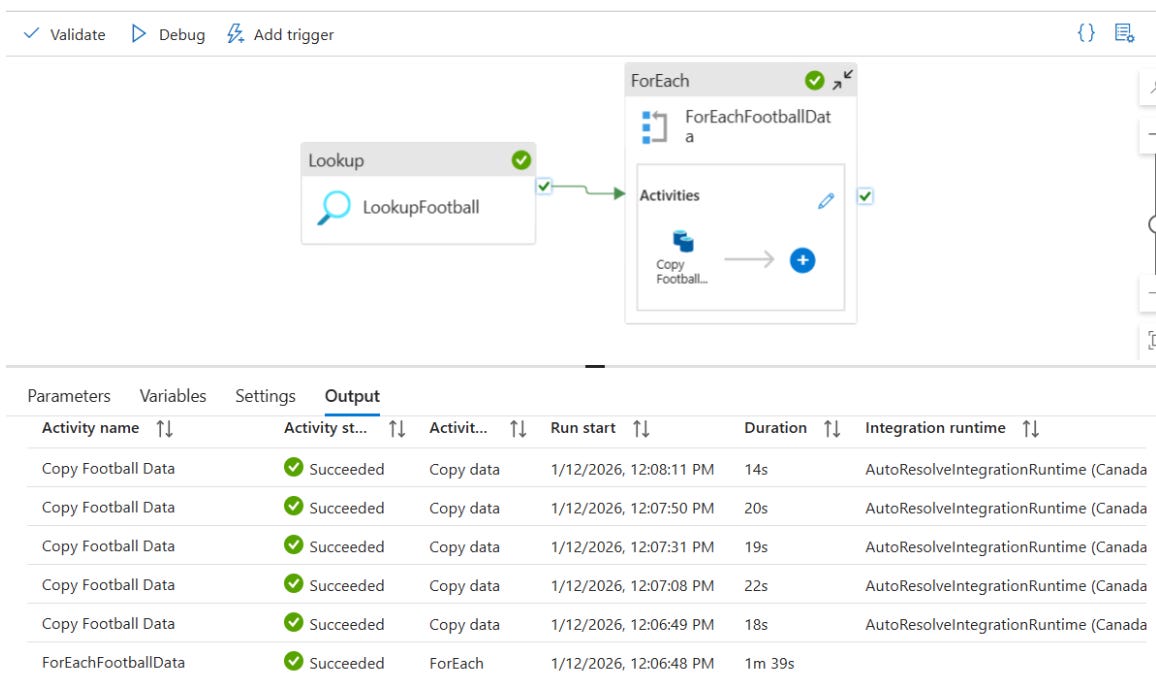
Fig 1.0
The pipeline (Fig 1.0) was designed to dynamically process JSON streams that specify which API endpoints to query, where to store the data, and what file names to use. It made use of a combination of Lookup, ForEach, and Copy activities, to automatically extracts the data and organizes it into dedicated folders for clubs, players, league standings, top scorers, and teams.
Next, we focused on building a reliable data foundation in Databricks with Delta Lake and this came with the implementation of a medallion architecture to organize data into bronze, silver ad gold layers for the maintenance of consistency across raw, cleaned, and analytical data layers.
Bronze Layer: Structuring Raw JSON Data
In the Bronze layer, raw JSON data was ingested, flattened and structured into Delta tables.
The first step is loading the raw data:
# Load league standings from the data lake
raw_league_standing = spark.read.format("json").load(
    "abfss://raw@footballanalyticstorage.dfs.core.windows.net/standings"
)
Because the API returns nested structures, we flatten the arrays to extract team-level information:
flattened_raw_standing = (
    raw_league_standing
    .withColumn("standing", explode(col("standings")))
    .withColumn("team_info", explode(col("standing.table")))
)
After flattening, we extract only the fields required for analytics:
bronze_league_standing = flattened_raw_standing.select(
    col("season.id").alias("season_id"),
    col("team_info.team.id").alias("team_id"),
    col("team_info.position").alias("position"),
    col("team_info.points").alias("points"),
    col("team_info.goalDifference").alias("goal_difference")
)
The resulting dataset is then stored as a Delta table in the Bronze layer for further processing.
Silver Layer: Cleaning and Standardizing Data
The Silver layer focuses on data refinement including the following operations:
renaming columns
removing duplicates
standardizing text fields
adding ingestion metadata
For instance, club identifiers and metric names are standardized.
fact_league_standing = (
    retrieved_league_standing
        .withColumnRenamed("team_id", "club_id")
        .withColumnRenamed("played_games", "total_games_played")
        .withColumnRenamed("goals_for", "total_goals_scored")
)
Club names are also standardized to avoid inconsistencies.
.withColumn(
    "football_club",
    lower(trim(col("team_short_name")))
)
Gold Layer: Dimensional Modelling Of Transformed Data
In the Gold layer, we implemented the dimensional modelling technique including the Slowly Changing Dimensions to handle historical changes as follows:
SCD Type 1 for clubs and season info,
SCD Type 2 for players and managers.
The introduction of surrogate keys came in handy to ensure versioning and prevented duplication.
First, we defined the dimension table:
CREATE TABLE IF NOT EXISTS dim_players (
  player_sk BIGINT GENERATED ALWAYS AS IDENTITY,
  player_id INT,
  club_id INT,
  player_name STRING,
  position STRING,
  valid_from TIMESTAMP,
  valid_to TIMESTAMP,
  is_current BOOLEAN
)
USING DELTA
During updates, existing records are closed when changes are detected.
dim_players.alias("target").merge(
    silver_players.alias("source"),
    "target.player_id = source.player_id AND target.is_current = true"
)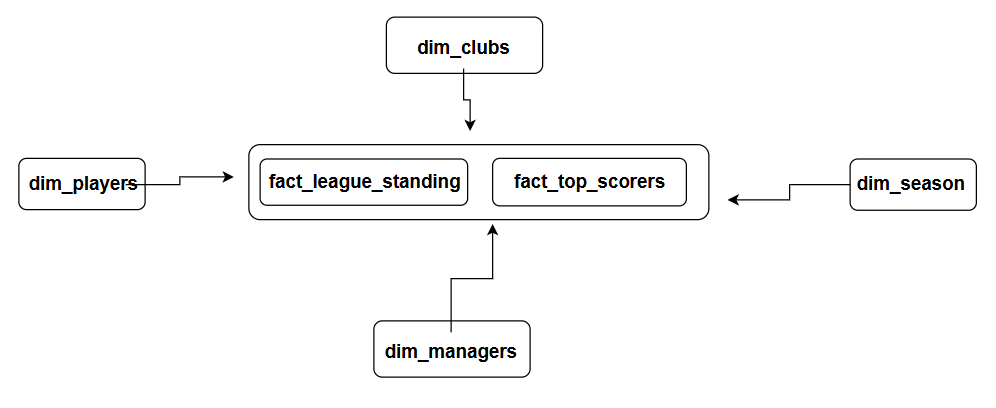
Fig 1.1 (Kimball dimensional galaxy model)
Optimizing Analytical Queries for Performance
The fact tables were also optimized in a galaxy schema (Fig 1.1) using:
broadcast joins and
coalesced output partitions
to make downstream BI queries efficient.
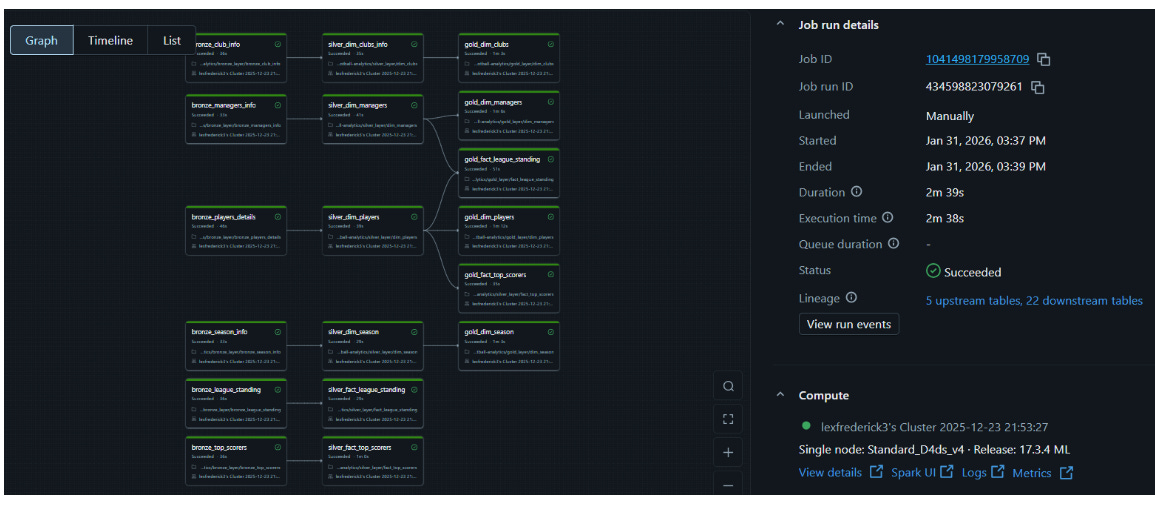
Fig 1.3 (Weekly Pipeline Run)
The pipeline (Fig. 1.3) illustrates how data flows across the architecture, beginning with ingestion in the Bronze layer, through the transformation and standardization in the Silver layer, culminating in a dimensional Gold layer, where the data is structured for analytical insights and intelligence.
Analytics & Dashboard
Once all data engineering best practices were checked-out and data foundational requirements satisfied, we built an AI-enabled BI dashboard to provide weekly insights, taking cognizance of the following KPI’s:
Average goals per game by team
Player performance (goals and assists)
Manager win-rate percentages
Weekly changes in league standings
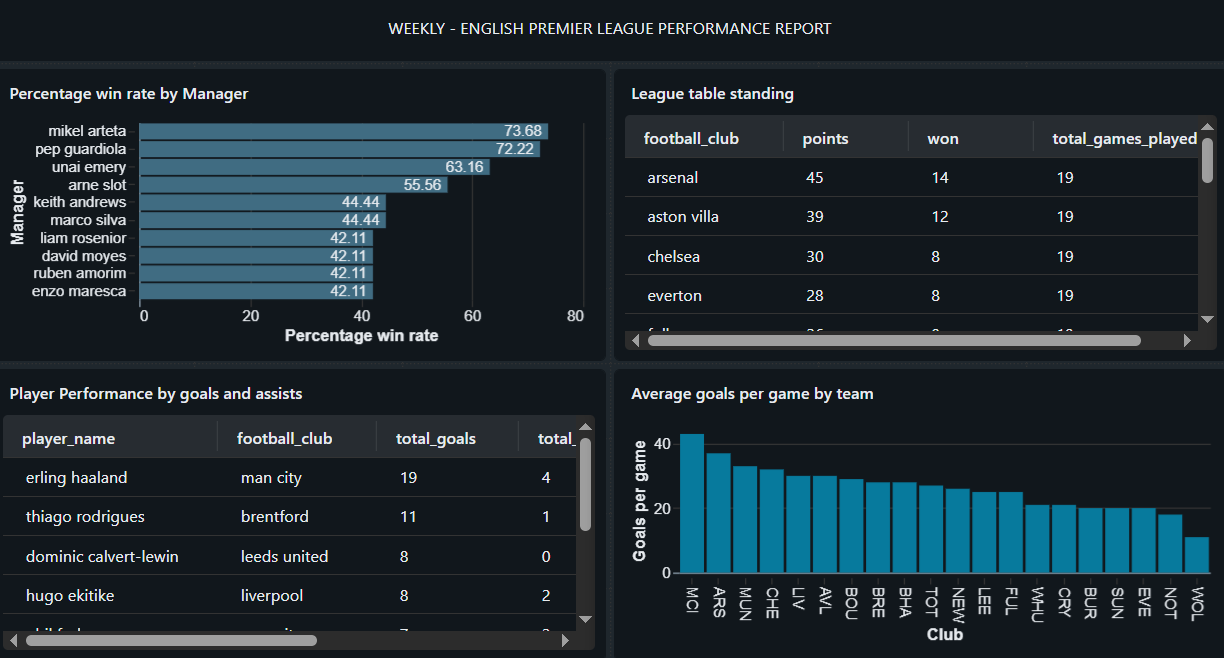
Fig 1.4
These metrics (Fig 1.4) not only show what happened but also reveal performance trends over time, so stakeholders could track momentum, evaluate managers, and see which players consistently contribute.
Finding Patterns Beneath the Table
In practice, league tables alone cannot capture hidden patterns, so we applied K-Means clustering to segment teams based on per-game performance metrics.
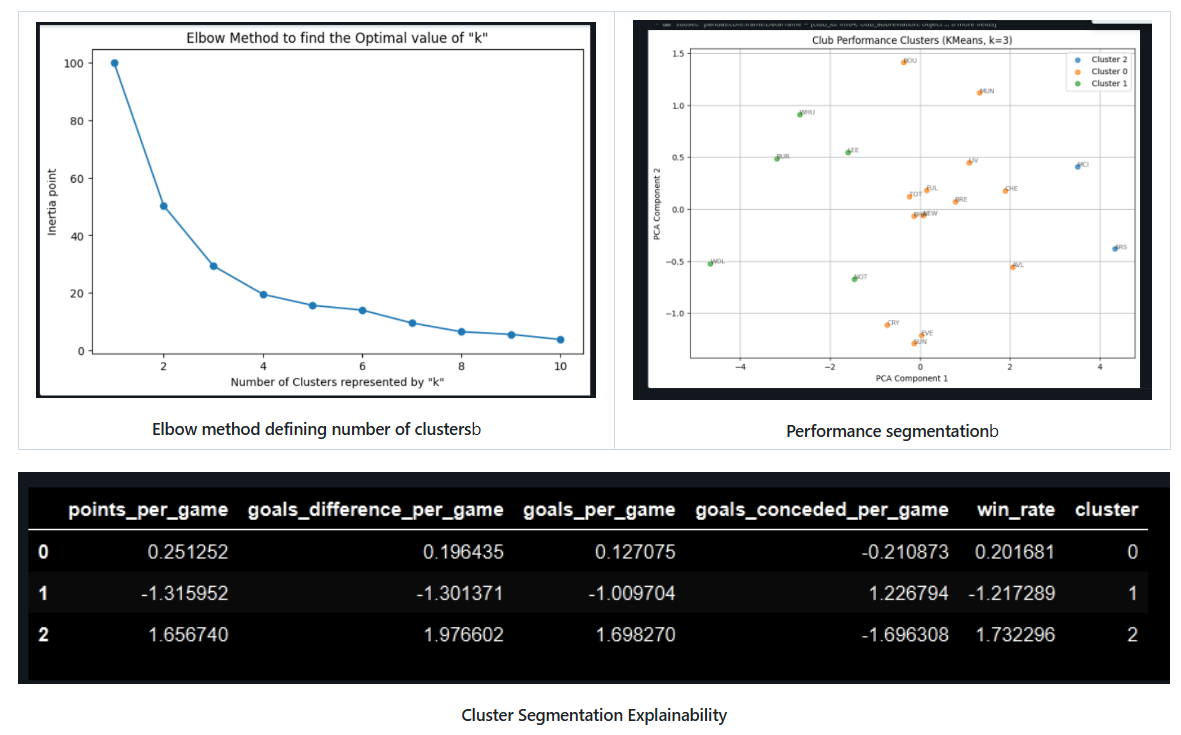
We scaled features to normalize data disparities, then used K-Means to group teams by performance similarity. This followed through with applying the Principal Component Analysis for dimensionality reduction to reduce data distribution noise and improve cluster readability. Then, the cluster centroids were analyzed in tabular form for explainability to generate human-readable performance labels, in order to reveal patterns such as points per game, win rate, goal difference, and overall competitive balance across teams.
Conclusion
The resultant project combines:
Automated data ingestion and orchestration
Structured, reliable data foundation on Databricks & Delta Lake
Historical modelling with slowly changing dimensions
Kimball-style dimensional galaxy schema
AI-enabled BI dashboards for insights
Explainable performance segmentation using K-Means and PCA
Here’s a link to the repository housing the project workflow:
https://github.com/datatribe-collective-labs/football-analytics
Authors: Matthew Utti (Data & AI Engineer, Datatribe-Collective), Krishna (Data Engineer, Datatribe-Collective)